
The year in numbers with 2012 values in parentheses:
- 0 (5) = Oddment pages posted
- 6 (8) = Road trips reported
- 77 (77) = Blog posts
- 57 (76) = Days on the road
- 1437 (2254) = Pictures posted — 406 (388) in the blog, 0 (131) in Oddments, and 1031 (1735) in Road Trips
 Clearly, I was quite the slacker last year. It didn’t feel like it but there’s the proof. Less of almost everything. Oddments were added in 2004 as a way to post non-road trip stuff. They felt a little redundant from the minute the blog was added in 2011 and I finally stopped doing them in 2013. There would not, apparently, have been many of them anyway since turning them into blog posts sure didn’t make the number of those shoot up. Total blog posts stayed exactly the same with regular weekly posts accounting for 52, reviews accounting for 12, and the remaining 13 coming from road trips and other asynchronous events. The 2011 and 2012 Rear Views contained rants about how crummy blog traffic statistics are. I’ll skip the rant this year and move onto the top five lists.
Top Blog Posts:
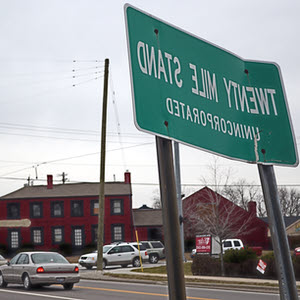
- Twenty Mile’s Last Stand
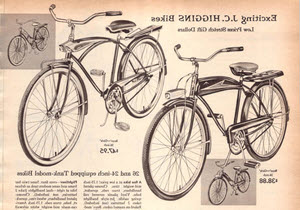
A 2012 article on an endangered historic building that ranked number one last year, too. This year’s attention was no doubt due to the building being leveled in April. An article on the demolition, Roadhouse Down, actually came in fourth for 2013 but I’m referencing it here rather than as a list entry. - My Wheels – Chapter 1 1960 J. C. Higgins Flightliner
In 2013, I started a series of articles on all the vehicles I’ve owned and the first post in the series became the most popular new post of the year. - Route 66 Attractions
This 2012 review of a GPS based product for tracing Route 66 moved to third after ranking fifth last year. - Ohio’s Revolutionary War Battle
The popularity of this article on the Battle of Picawey probably comes from mentioning George Rogers Clark, Tecumseh, and the War of 1812 all on the same page. - Chili All Week and It’s Cold, Too.
A report on eating at a different Cincinnati chili parlor each day for a week. A subsequent article, 5 More 4s, covered five additional parlors though those visits were not on consecutive days. Note that this post would have been bumped from the top five if I had allowed both Twenty Mile House items to claim a place. That’s why I did what I did, of course. I like this article and, in this teeny tiny bit of cyberspace, I’m the boss.
Top Non-Blog Posts:
- Tadmor
Oddment page on a 2006 visit to the site of the town of Tadmor that also ranked first in 2011 and second in 2012. I believe traffic is largely from a Wikipedia article on ghost towns but a mention and link on Jim Grey’s Down the Road blog also accounts for quite a few visitors.. - Cincinnati Summer of Love Reunion
Oddment page on a 2007 concert featuring area performers from 1967. The Lemon Pipers, Sacred Mushroom, Tony and the Bandits, and Haymarket Riot were all represented and I suspect each accounts for some of the traffic as do some of the individuals mentioned. - The 2010 Fair at New Boston
Oddment page on the 2010 version of an annual recreation of the 1790s. It is held at the same site talked about in Ohio’s Revolutionary War Battle, the fourth ranking blog post and the two probably share visitors. - Lincoln Highway Centennial Tour
The highest ranking non-blog and non-oddment (pseudo-blog) page was the base page for the year’s biggest trip, the 35 day coast-to-coast Lincoln Highway drive. This is also the only item in the non-blog list that was a new post this year. - High Speed Privies
Oddment page on the 2004 running of the Great Outhouse Race at Penn’s Store in Kentucky. It once contained a clear nude photo taken at the store for Playboy that generated some traffic. The photo has long been obscured but searches related to it are clearly what brought the visitors. I have no idea what triggered the renewed interest.
Visits to the website increased to 170,809 from 91,233 last year and page views rose to 467,084 from 337,996. WordPress’ Jetpack reports 6,863 views (up from 5,965) for the blog in 2013.
I ended last year’s Rear View with a prediction that I would not “get very jiggy in 2013” then proceeded to make the prediction come true. The closest thing to a website change last year was the decision to not add any more Oddment entries and that did not result in any actual alterations. What’s there will remain and it’s possible I could turn to that method again someday if something comes along that doesn’t fit the blog format. .
 Available blog statistics kind of suck. At least they do for WordPress Jetpack statistics on a self hosted blog that is only a portion of a website. One issue is that the most popular “page” is almost certain to be something called “Home page / Archives” which is a swirling mix of the multiple pages displayed at the blog’s root or the multiple pages that satisfy a search. I have AWStats generated numbers for the entire site, including the blog, but those have some problems, too. For one thing, counts include all of the individual pages appearing in the previously mentioned “Home page / Archives” many of which are not actually viewed. For another, AWStats numbers include blog page references that I’ve made myself in creating and maintaining the blog. I try to keep these to a minimum but eliminating them completely is not possible. In the end, though, I do believe the relationship of the numbers is meaningful even if the numbers themselves aren’t all that precise. So here are the top five blog and non-blog entries and I’ll follow the lists with some overall numbers.
 A 2005 survey reported that people were spending an average of 2.8 minutes a day deleting email spam. Whether that was for the entire US population, the 75% of internet users they reported receiving spam messages daily, or some other group is unclear. Regardless of who was doing the deleting, the survey went on to state that the resulting loss in productivity was costing $21.6 billion dollars a year. My search failed to turn up more recent statistics although I imagine they’re out there. Or maybe not. Maybe the statisticians are now too busy deleting spam to conduct surveys.
 It was the pending “loss” of these comments that prompted this post. Most are just aggravating but a few are hilarious. They are almost always filled with praise in hopes, I assume, of winning my approval but the typical message is such a jumble that I can’t imagine even the most desperate ego succumbing. Like newspaper horoscopes, the messages never mention anything specific about the post they are supposedly responding to. The majority appear to be from Russia, Eastern Europe, and Brazil. There have been a few bulk posts. A bunch once showed up pushing a particular brand of shoe and there were a couple bursts touting some dress label. At one point I received quite a few from someone in Brazil saying they would “adore to reveal” something (a Portuguese word I’ve yet to find a translation for) “in web cam”.
 So now that I’ve explained why I don’t like to post viewer stats, here are some hidden in a paragraph for folks who bother to read outside the bullet list. For 2011, the entire website had 43,213 visits with 227,060 page views. The most popular page was the